Leave a Message

Thank you for your message. We will be in touch with you shortly.

Oakville Market Watch

Oakville Single Family Home Market Watch - March 2026

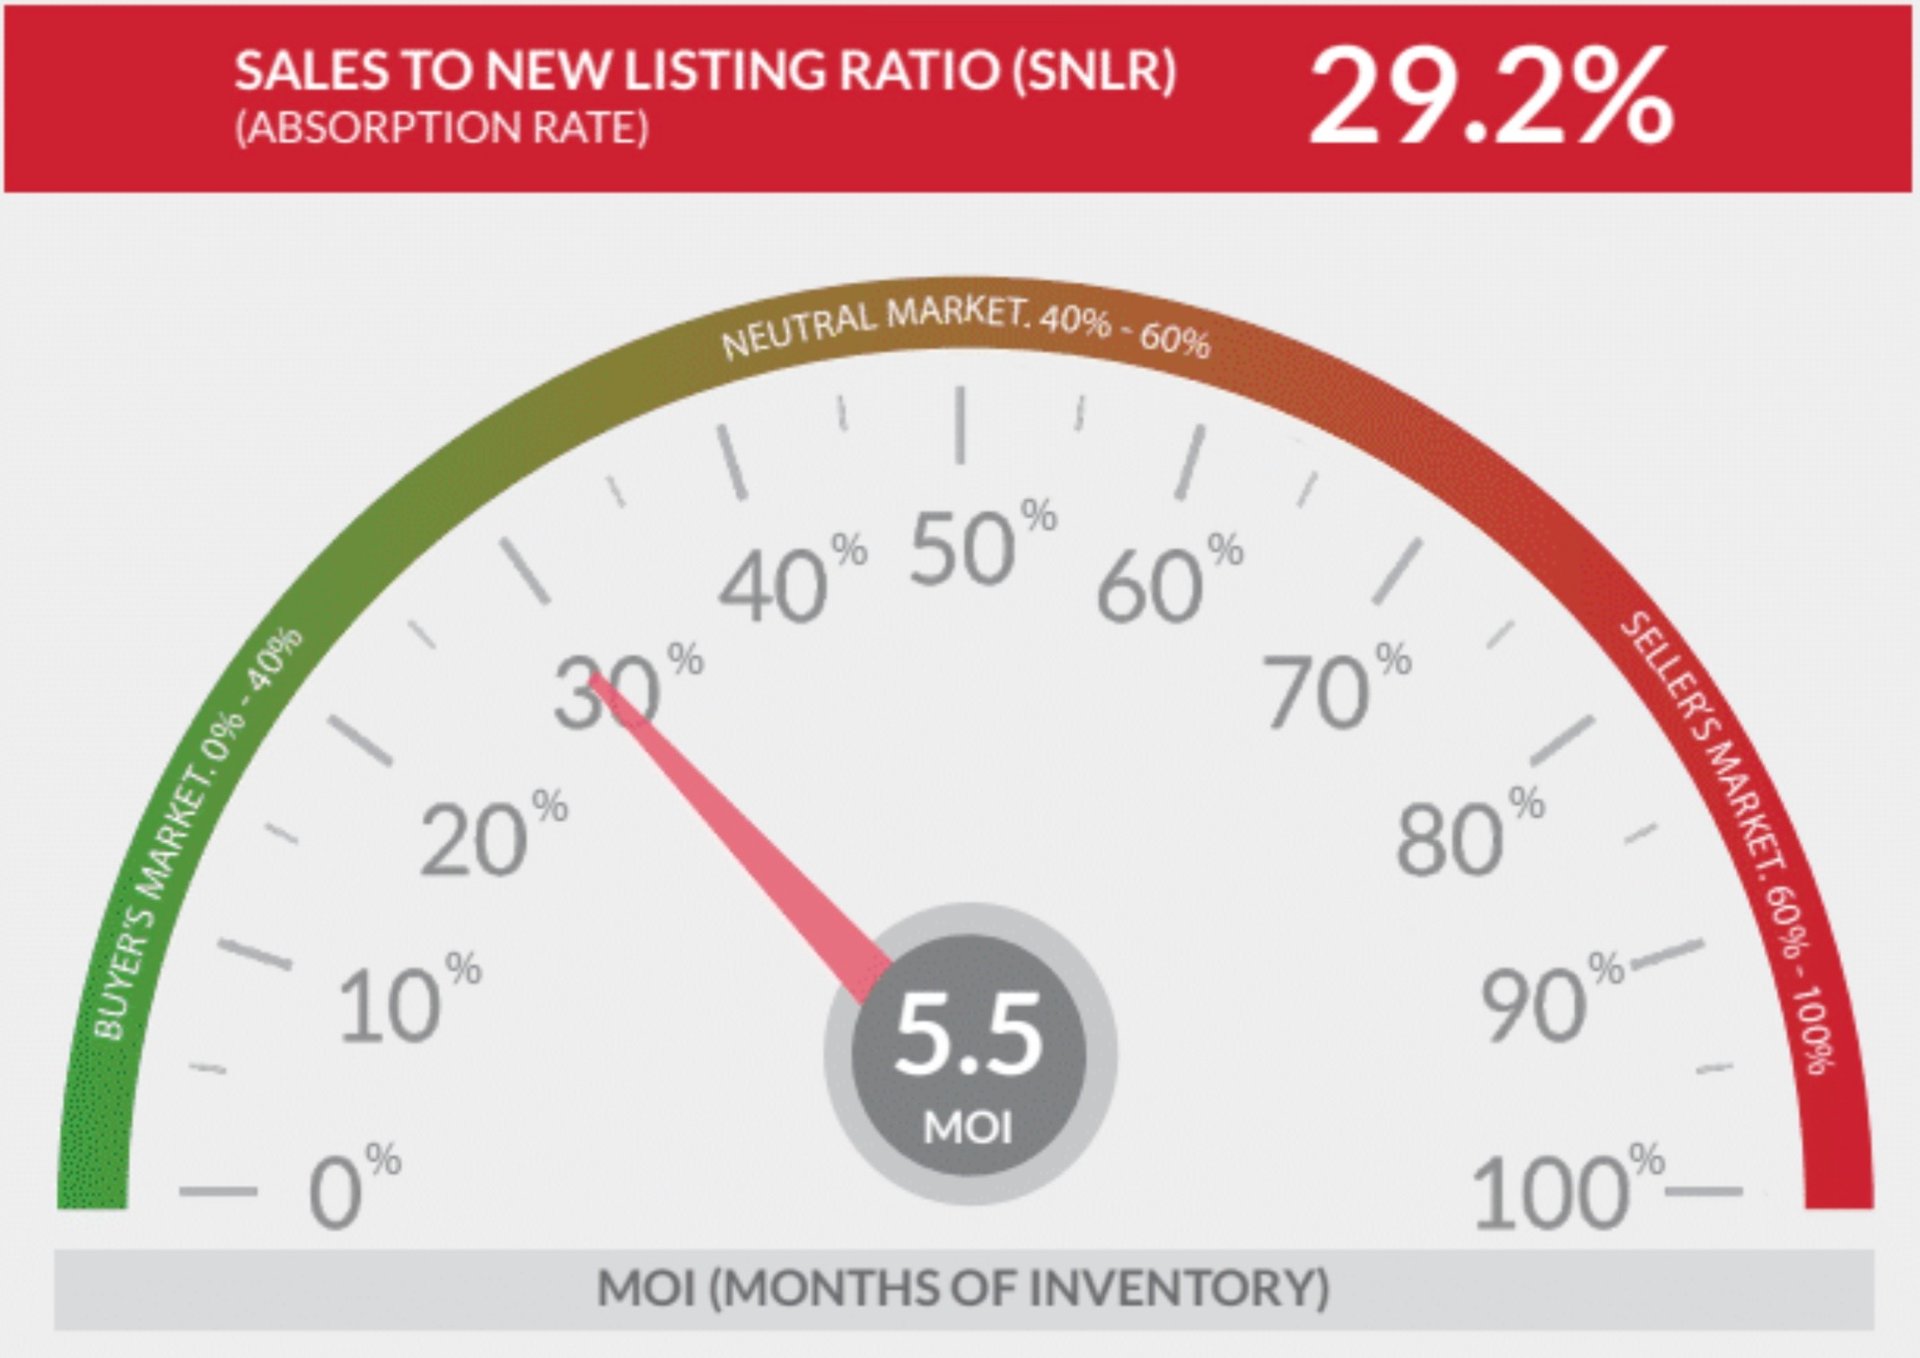
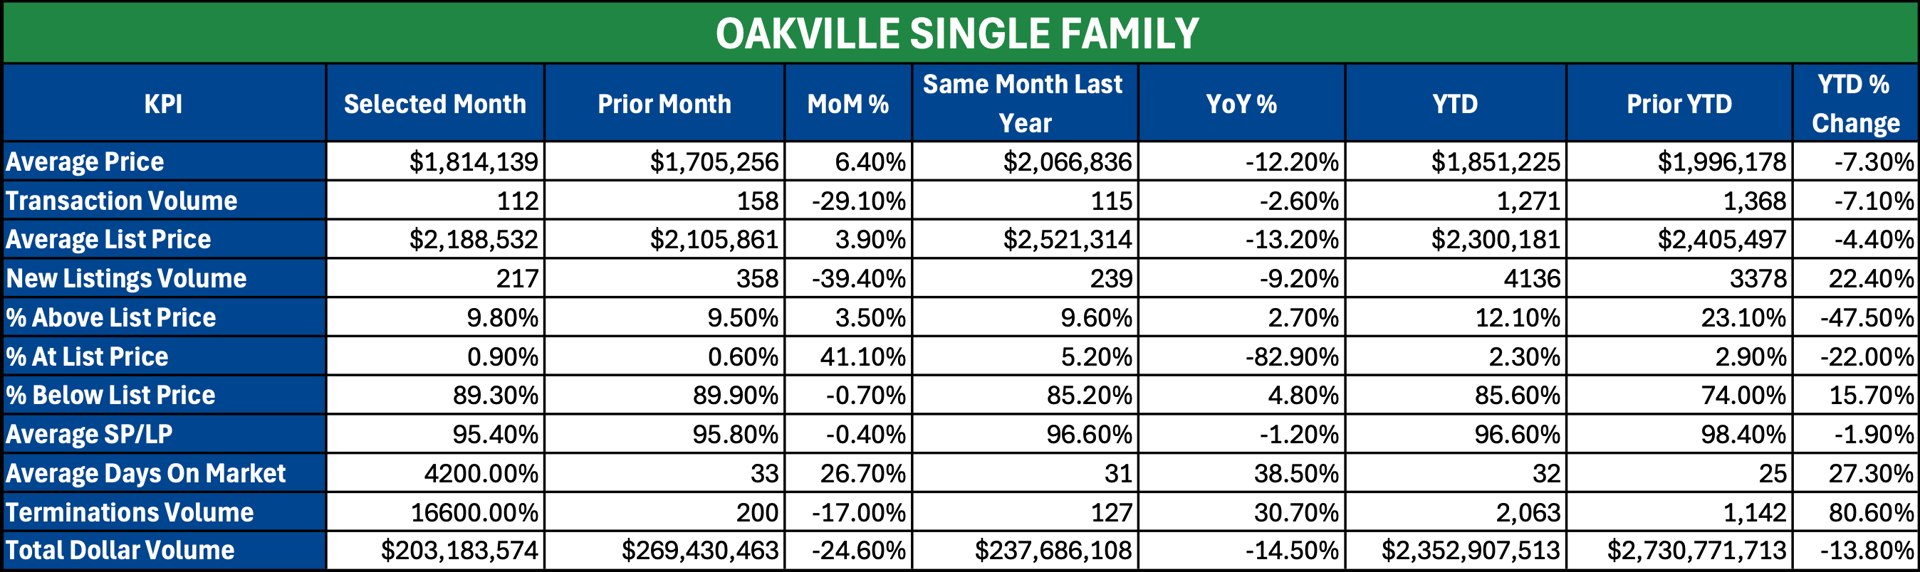
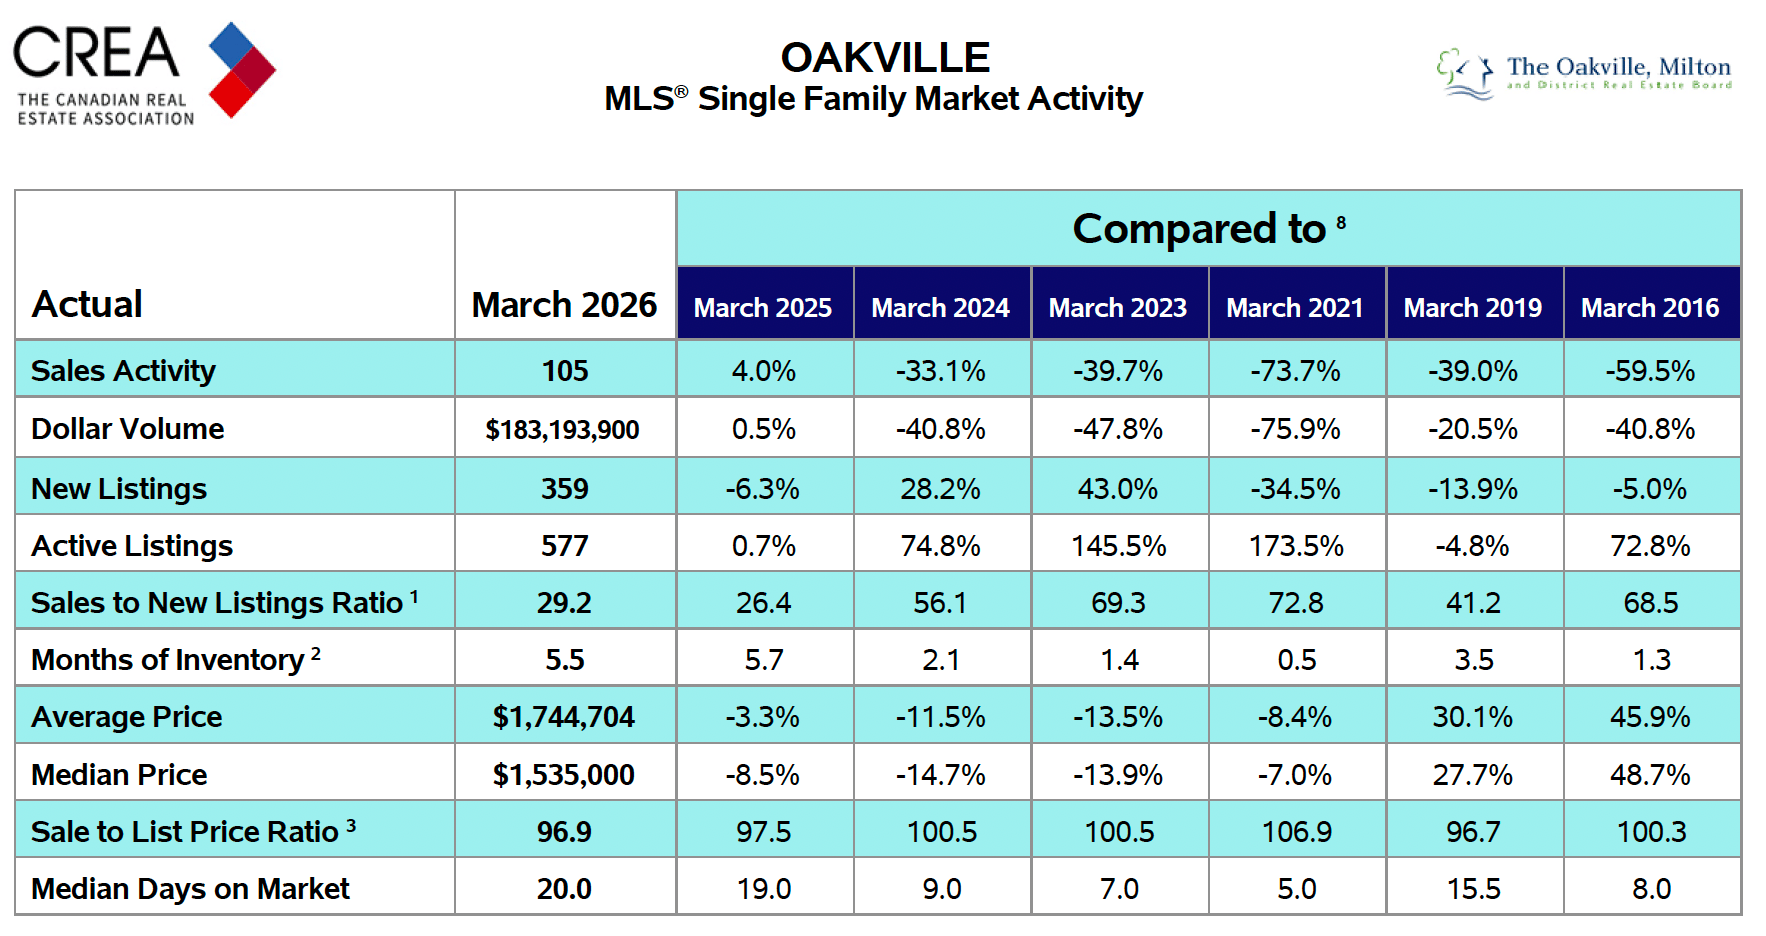
Oakville Single Family Market Report - March 2026

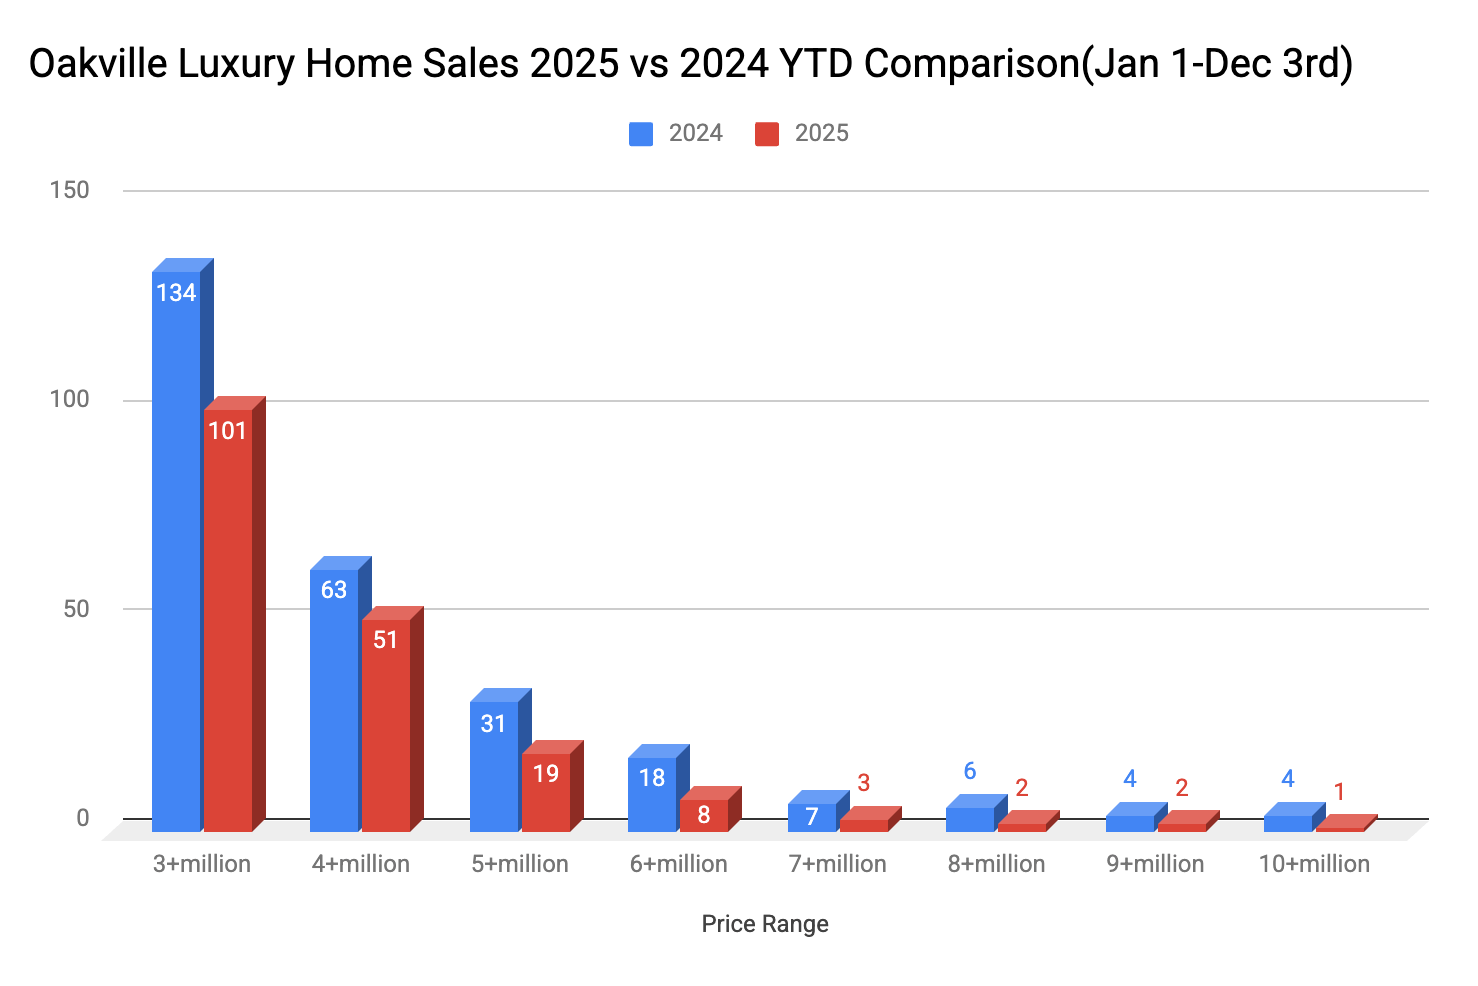
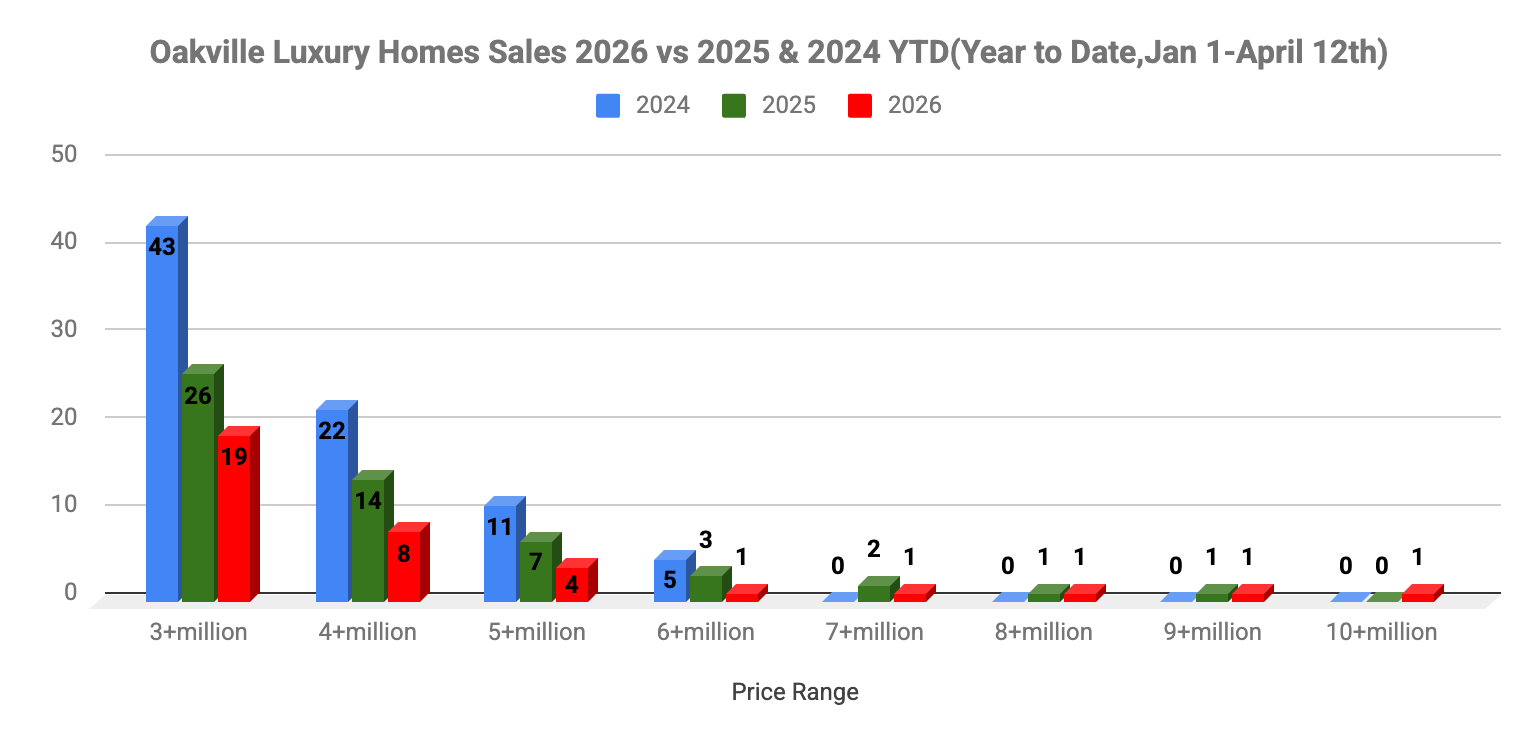
Oakville Luxury Market Report (YTD Jan1-April 12)

South East Oakville Market Activities Report – March

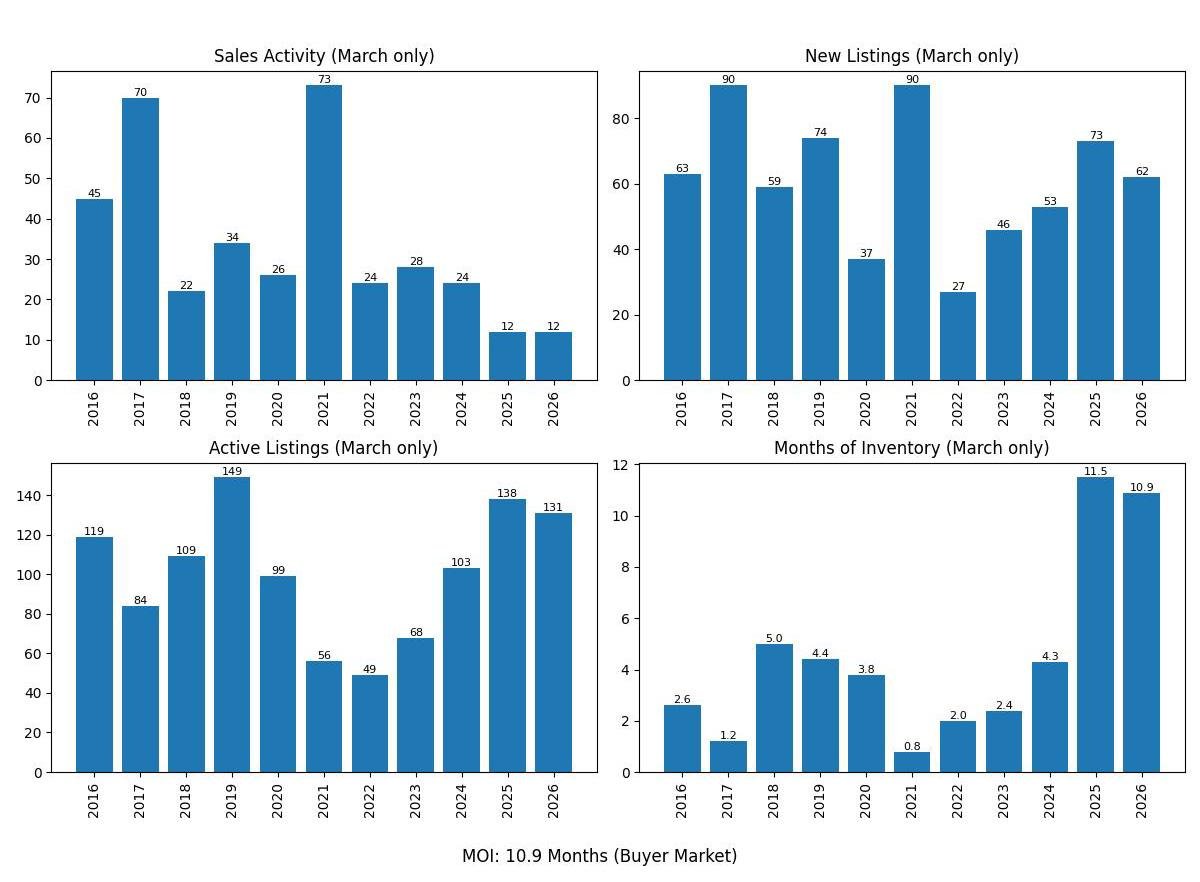
The 2026 Spring Market Reality in South East Oakville

The South East Oakville market has officially entered the early spring phase—but unlike previous years, this is not a rising tide lifting all homes.

Inventory has increased significantly across Morrison, Old Oakville, and Ford, while buyer demand remains selective and cautious. The result is a split market, where outcomes vary dramatically based on pricing and presentation.

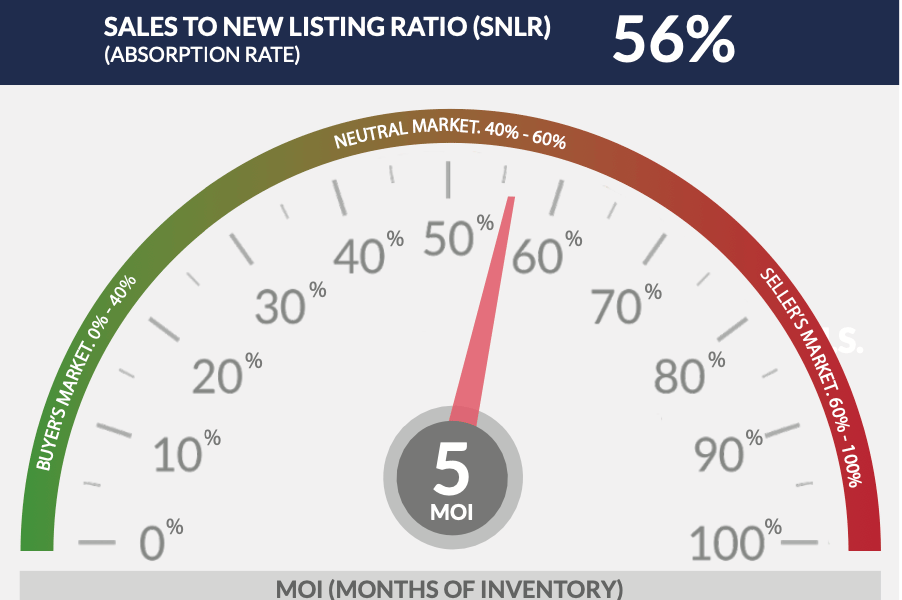
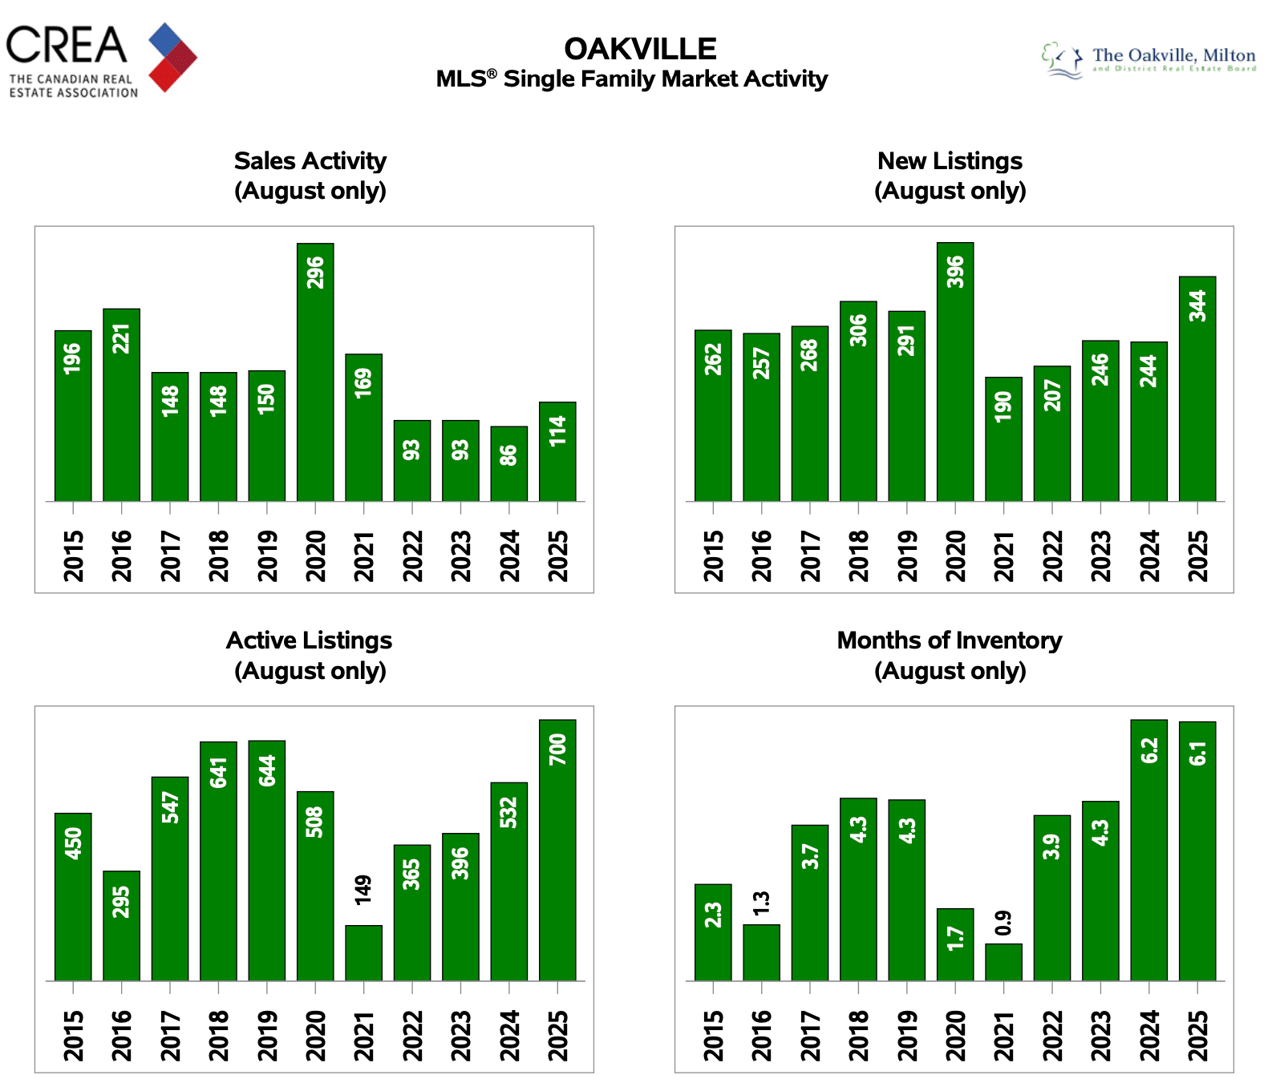
  • Sales activity remains relatively low
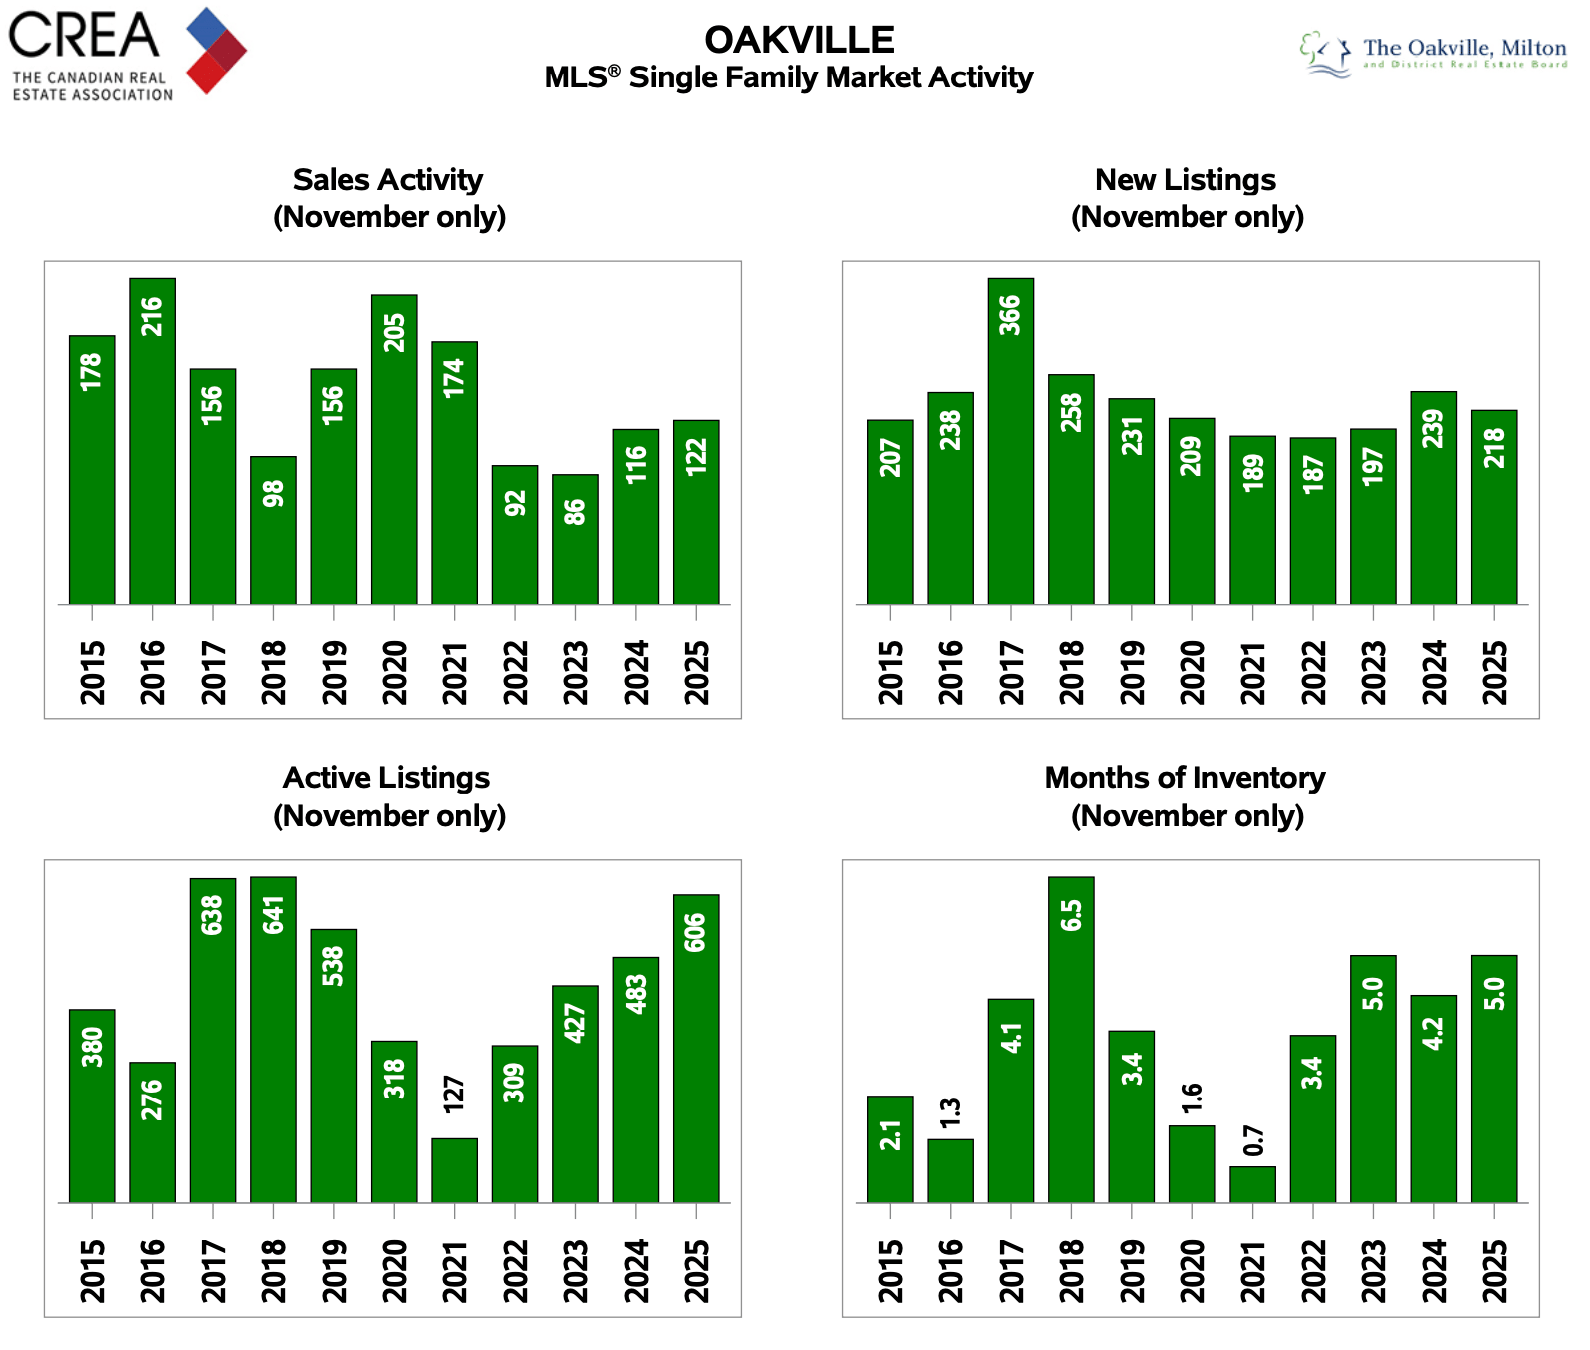
  • Inventory continues to build
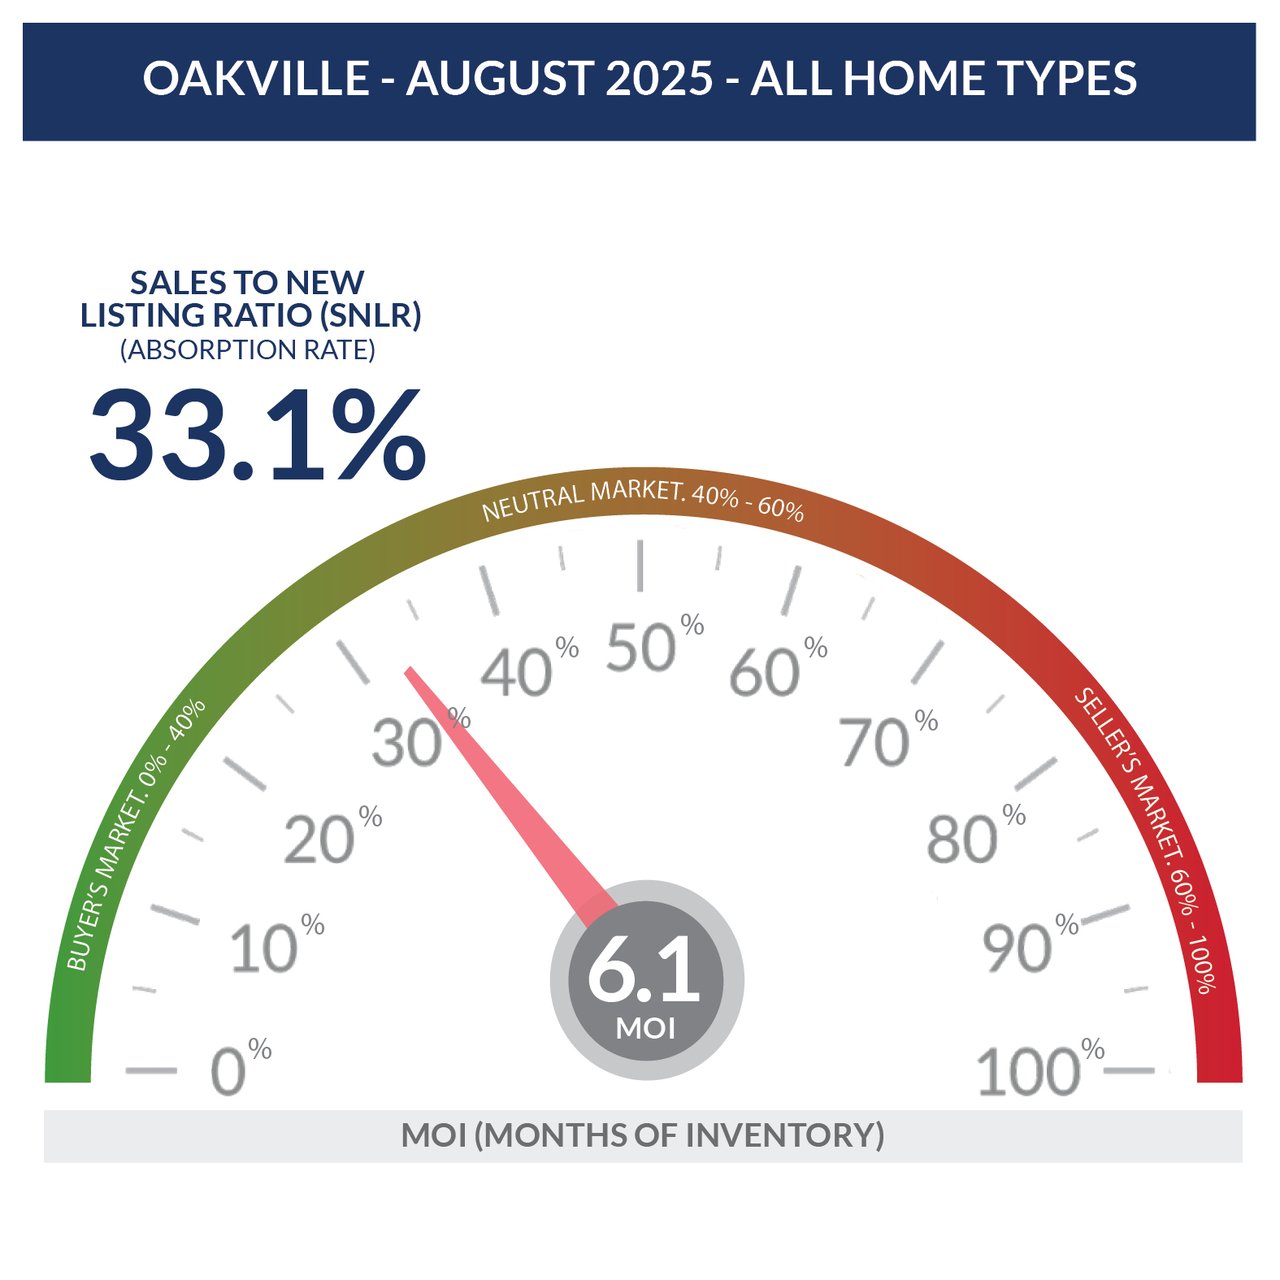
  • Months of Inventory (MOI) remains elevated in key luxury pockets

This creates a window of opportunity—but only for well-positioned properties.

South West Oakville Market Update 


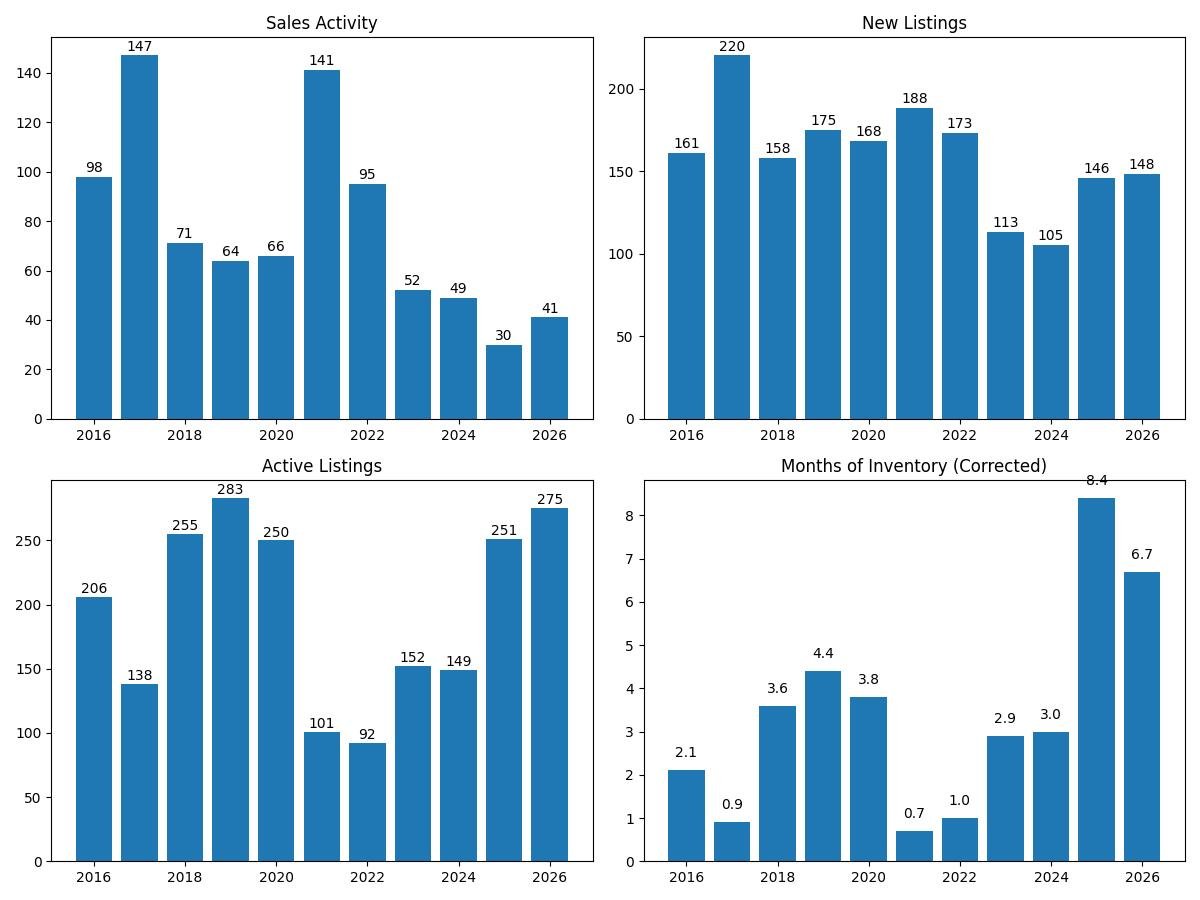
The South West Oakville market—encompassing Southwest, West, Central Oakville, and Bronte—is currently defined by high inventory and a widening gap between neighborhoods. While the overall region sits at 6.7 months of inventory (MOI), the experience for sellers varies wildly depending on their specific pocket.
Inventory Saturation: Active listings have surged to 275, a near-decade high. This is most extreme in Southwest and West Oakville, where MOI has hit 15.0 and 14.7 respectively, firmly entrenching these areas in a "Buyer's Market."

Oakville November market report

November Oakville Market Snapshot
SNLR: 56%
MOI(MOnths of Inventory): 5months


What’s Ahead in 2026?  2025 Market Recap & 2026 Outlook

  • 2025 was a cooling and correction year with lower sales, modest price adjustments, and value‑driven buyers.

  • Sales declined approximately 8% on average compared to 2024, or 25-50% for higher price range homes (please refer to the charts behind)

  • Buyers were highly selective, prioritizing premium location, lot size, and architectural quality.

  • The year end SNLR has jumped to 56% from 22-35% in most of the year,  as more homes are taken off the market before the holiday season and the number of new listings has dropped.

  • In 2026 new year, with interest rate cuts continuing to take effect and confidence gradually improving the market activities and sales are expected to show a stabilization and gradual recovery, although the GTA general market is expected to continue to have further price moderation, the prices in sought-after areas of south Oakville are likely in a flat-to-modest-growth environment, assuming the economic and buyer confidence continue to improve and there's no further macroeconomic and geopolitical risks.

  • 2026 new year’s market activities and sales are likely to improve, if you're thinking of selling or making a move in the new year, it’s always good to start planning as early as from now.  Fixing up or minor renovations, staging, strong marketing, and strategic precise pricing ( our expertise) will significantly influence outcomes, please contact us to have an obligation free consultation.


Disclaimer: This market outlook is based on available data, trends, and professional interpretation, forecasts are not guarantees, and actual market performance may differ. Please seek independent advice for your specific real estate needs.


Month over Month and Year over Year market stats - Nov 2025


Oakville August market report

Chart 1

Oakville’s August detached home SNLR (Sales to New Listings Ratio) is at 33% and MOI (Months of Inventory) is at 6.1, which are the same as July.

Oakville single family home market Year over Year comparison:
Sales: Up 32.6%
New listings: Up 41%
Active Listings: Up 31.6%
MOI: Down 2%
Average Price: Down 7.6%
Median Price: Down 3.2%

What do these charts mean for the market? Call us for a chat.

Chart 2 Chart 3

Oakville Market Update - November 2024

Chart 1

In November, Oakville all home types SNLR (Sales to New Listings Ratio) is 38.6%. It’s getting close to a balanced market.

There’s a 5.7% YoY average price increase, a 62% YoY sales increase, and a 30% YoY new listings increase.

Chart 2

Work With Us

Whether you're buying your first home or selling a property, we’re here to make process seamless and stress-free. With personalized guidance and a commitment to your goals, we ensure every transaction is handled with care and expertise from start to finish.

Follow Us on Instagram